4.3. Sensor Models with Continuous State#
![]()
From Gaussian to non-Gaussian sensors.
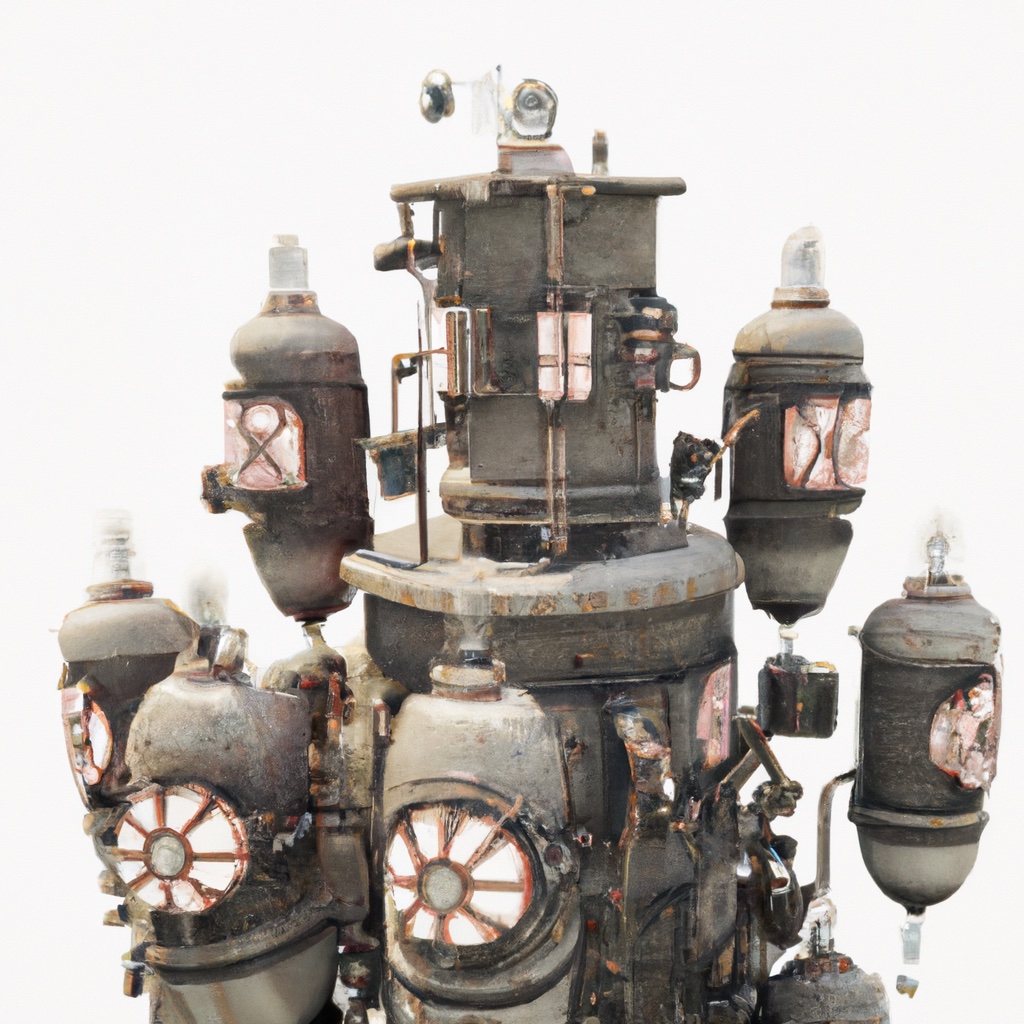
In the previous chapters, we have used sensors that could be characterized using fairly simple probabilistic models, either discrete conditional probability distributions (e.g., conductivity for the trash-sorting robot and light sensing for the vacuum cleaning robot), or one-dimensional Gaussian distributions (as for the trash-sorting robot’s weight sensor). In this section we introduce three more realistic sensors, each of which are similar to sensors that are frequently used in modern robotic systems:
a proximity sensor
an RFID range sensor, which has a non-linear measurement model
a GPS-like location sensor, which uses a Gaussian conditional density.
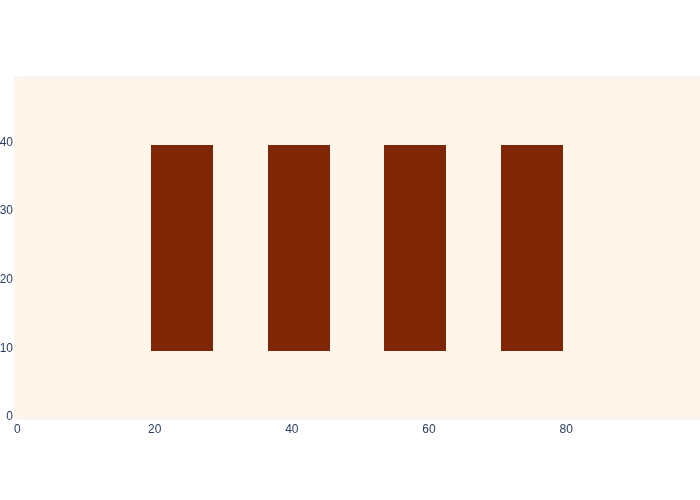
Let us extend the example from the Section 4.1, a warehouse of 100m x 50m, by imagining four sets of shelves placed at regular intervals.
We can represent this in code using a 2D image. We can simply use a numpy array to do so, and indeed this is what we do. A base map for this environment is defined in gtbook.logistics.
base_map = logistics.base_map
print("type(base_map):", type(base_map))
print("base_map.dtype:", base_map.dtype)
print("base_map.shape:", base_map.shape)
type(base_map): <class 'numpy.ndarray'>
base_map.dtype: float64
base_map.shape: (50, 100)
We plot this base_map as an image, using the conveniently defined show_map function, in Figure 1.
#| caption: The logistics warehouse base map that we use throughout this section.
#| label: fig:logistics_base_map
logistics.show_map(base_map)
In the remainder of this section we show how to use this map to simulate the three sensors we listed above.
4.3.1. A proximity sensor#
A binary sensor over a continuous space.
We consider a sensor that measures the proximity of the robot to obstacles. For example, this could be operationalized using small infrared sensor/receiver pairs, or a magnetic sensor that measures proximity to one of the metal structures within the warehouse.
This is a binary sensor, just like the conductivity sensor we saw in the trash sorting example. However, a big difference is that the measurement \(z_k\) of this sensor at time \(k\) depends on the continuous state \(x_k\). In other words, this is a kind of hybrid, discrete-continuous sensor model.
This sensor can be modeled using a signed distance function or SDF, which is a well-known concept from graphics. An SDF measures the distance from any point \(x\) to the nearest obstacle, is positive if this location is outside the obstacle, and negative if it is inside the obstacle. Robots will never see negative SDF values. Let \(X_{obs}\) denote the set of points on the boundary of the obstacles (the borders of the shelves, and the walls that enclose the warehouse). For a given point \(x \in {\cal D}\), the distance to the nearest obstacle can be defined by
We now define the signed distance to be negative for \(x\) is inside the obstacle, and positive for points outside the obstacle:
We can use the function sdf to model our proximity sensor by defining a conditional probability distribution \(P(z_k=\text{ON}|x_k)\) as a function of \(\mathrm{sdf}(x)\). For example, if obstacle detection is very reliable for for \(d(x) < d_0\), but degrades rapidly as \(d(x)\) increases (i.e., as the robot moves further from obstacles), we might define
where the value of \(\alpha > 0\) determines how rapidly the probability decreases. Because the conditional probability \(P(\cdot | x_k)\) is a valid probability distribution, we can immediately conclude that \(P(z_k=\text{OFF}|x_k) = 1 - P(z_k=\text{ON}|x_k)\).
Below, we use a simpler model, which assumes that the proximity sensor perfectly detects when the robot is within distance \(d_0\) of an obstacle:
#| caption: The likelihood of locations in the map when the proximity sensor reads ON.
#| label: fig:logistics_proximity_map_on
logistics.show_map(logistics.proximity_map_on)
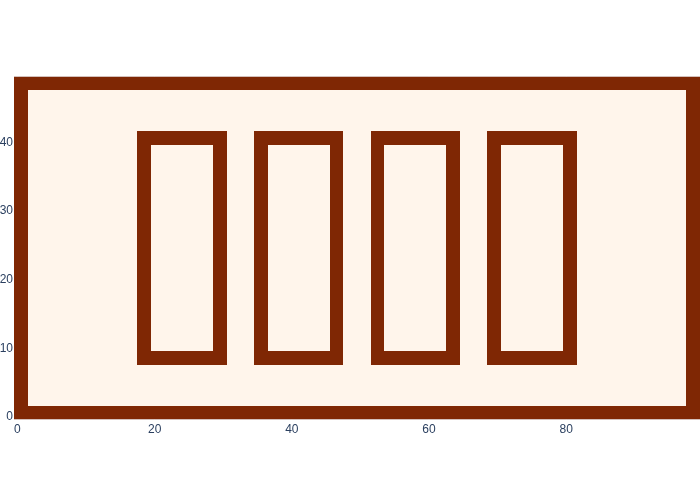
Figure 2 shows the likelihood for \(z_k = \text{ON}\).
Recall that the likelihood \(l(x_k;z_k=\text{ON})\propto P(z_k=\text{ON}|z_k)\) is a function of the state \(x_k\), so we can show it as a map.
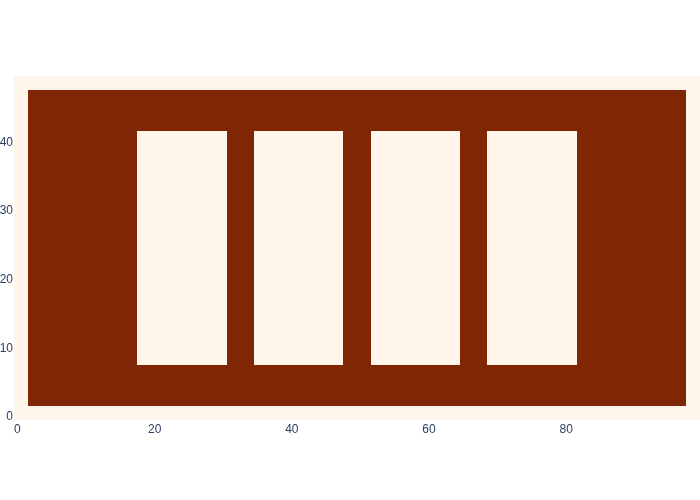
Note that we denote a likelihood over a continuous variable with lowercase \(l()\), in analogy to the lowercase \(p()\) we use for densities. For this specific sensor model, at any location, the likelihood \(l(x_k;z_k=\text{OFF})\) of \(x_k\) given that the sensor is OFF will be the mirror image of the ON map, as shown in Figure 3.
#| caption: The likelihood of locations in the map when the proximity sensor reads OFF.
#| label: fig:logistics_proximity_map_off
logistics.show_map(logistics.proximity_map_off)
4.3.2. A Range Sensor#
A range sensor returns the distance to a landmark.
Let us assume that the operator of the warehouse has installed a number of beacons throughout the warehouse, at strategically placed locations. The measurement function \(h(x_k; b_i)\) for a sensor measuring the range to a beacon at location \(b_i\) is given by:
The energy emitted by an RFID beacon is, of course, finite. Therefore, there is some maximal distance, say \(d_{\max}\), beyond which the sensor is unable to detect the beacon. In this case, the sensor does not return any range measurement, and indicates “no beacon present.”
This is actually not an unrealistic model; there is a technology called radio frequency identification (RFID), which can be detected using a small radio receiver, and some of the more expensive variants allow for the range to the RFID to be measured, if not very accurately.
As with the motion model described above, it is typical to assume additive Gaussian noise for sensors, leading to the measurement model:
in which \(w_k\) is the noise term (unrelated to the noise in our motion model). Using this model, we see that the conditional probability of a range measurement \(z_k\) given a continuous state \(x_k\) is a Gaussian, even though its mean \(\mu\) is computed as a nonlinear function of \(x_k\).
Note that the range is one-dimensional, so we again use the simpler univariate Gaussian, and we use the variance \(\sigma^2\) to characterize the zero-mean Gaussian noise.
The equation below for the likelihood of the state \(x_k\) given a measurement \(z_k\) (to beacon \(b_i\)) seems similar to a Gaussian density:
However, because the likelihood is a function of \(x_k\), and not a function of \(z_k\) (remember, \(z_k\) is given when we compute the likelihood for state \(x_k\)), the likelihood does not even remotely look like a Gaussian! In fact, the likelihood will be high where the state agrees with the given range measurement, i.e., in an annulus of the right radius around the beacon. The “width” of the annulus will be proportional to the measurement noise \(\sigma\).
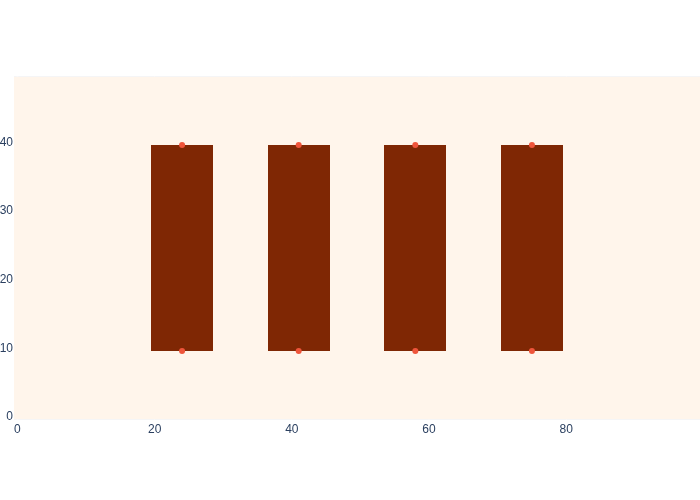
To make this concrete, let us add eight beacons to the base map, at either end of the shelves, which seems very useful for robot navigation. Again, we define these in gtbook.logistics.beacons, and we show them in Figure 4 on the base map.
#| caption: The eight beacons in the logistics warehouse, at the locations shown in the base map.
#| label: fig:logistics_beacons
logistics.show_map(base_map, logistics.beacons)
We can implement a range function that works with any beacon:
def rfid_range(position, beacon, max_range=8):
    """return range to given beacon"""
    range = np.linalg.norm(position-beacon)
    return float('inf') if range>max_range else range
For example, if the robot is at \((20.5, 7.5)\), we are within range of beacon \(0\):
state = gtsam.Point2(20.5, 7.5)
beacon0 = logistics.beacons[0]
zk = rfid_range(state, beacon0)
print(f"range to beacon 0 = {zk:.2f}")
range to beacon 0 = 4.03
Now we are in a position to show the annulus-like likelihood images in Figure 5.
#| caption: The likelihood of locations in the map when measuring a range of 4 meters to beacon 0.
#| label: fig:logistics_likelihood_beacon0
dist = np.array([[rfid_range(xy, beacon0) for xy in row] for row in logistics.map_coords])
sigma = 1  # In meters
likelihood = np.exp(-1/(2 * sigma**2) * (zk - dist)**2)
logistics.show_map(likelihood, logistics.beacons)
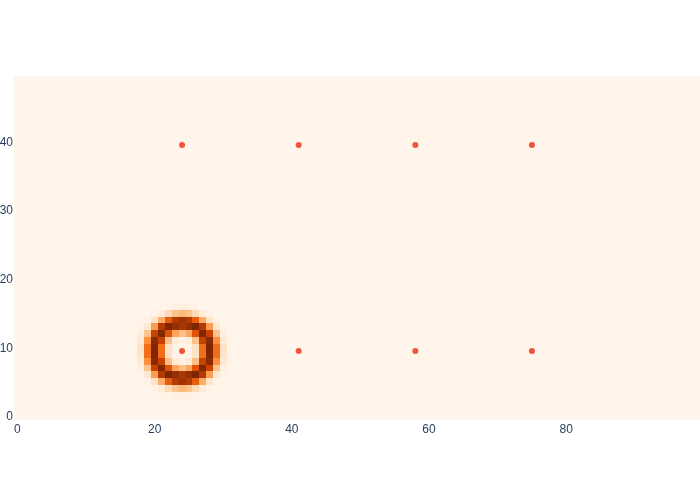
As you can see, all positions at a range of approximately 4 meters have a high likelihood.
4.3.3. The Case of No Beacons in Sensing Range#
The absence of beacons in the sensor data can be informative.
The likelihood model above is useful when a beacon is within sensing range of the RFID reader. But what happens when all beacons are out of range? Let us assume that the RFID reader always returns the range to the closest beacon, along with its identification number, but it returns a special value when all the beacons are out of range. Formally, we can model this as a pair of values that is returned by the sensor,
where \(\bar{N}\) is the set of integers extended with None, and \(\mathbb{\bar{R}}^+\) is the set of positive real numbers extended with \(\infty\). Note that in the case of additive Gaussian sensor noise, it is possible to
have \(z_k < 0\) returned by the range sensor. In such cases, we might simply assign \(z_k = 0\).
In code this is easy to implement: if all sensors are out of range we return None for the identification and float('inf') for the range. For example, here is some code that returns the range to the nearest beacon (given in a list beacons) and None, float('inf') if all are out of range:
def rfid_measurement(position, max_range=8):
    """Simulate RFID reader that returns nearest RFID range or (None,inf)."""
    ranges = [rfid_range(position, beacon, max_range) for beacon in logistics.beacons]
    range = min(ranges)
    return (np.argmin(ranges), range) if range<=max_range else (None,range)

print(rfid_measurement(gtsam.Point2(20,7)))
print(rfid_measurement(gtsam.Point2(7,7)))
(0, 4.716990566028302)
(None, inf)
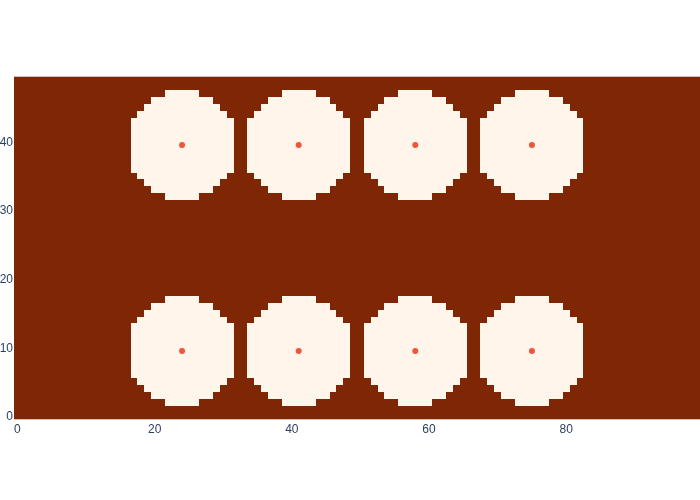
The special “out of range” measurement conveys a lot of information as well! If we are within range of a sensor, the likelihood function is as above (an annulus). But when we are out of range, the likelihood function has a very strange shape indeed: it will be 1.0 for all continuous states out of range of all beacons, and zero for states within range of a beacon. This makes sense: if the robot were within range of a beacon, the sensor would have returned an actual range, not infinity. This in turn tells us that the robot must be somewhere outside the range of all beacons, which is very powerful information. The likelihood for this case can be plotted with the following code, whose output is shown in Figure 6.
def out_of_rfid_range(position, max_range=8):
    id, _ = rfid_measurement(position, max_range)
    return id == None

out_of_bound_map = np.array([[out_of_rfid_range(xy) for xy in row] for row in logistics.map_coords])
#| caption: The likelihood of locations in the map when the range to the nearest beacon is out of range.
#| label: fig:logistics_likelihood_out_of_bound
logistics.show_map(out_of_bound_map, logistics.beacons)
4.3.4. A GPS-Like Location Sensor#
A simple conditionally Gaussian measurement.
The last sensor we will consider, a GPS-like location sensor, is a bit of a cheat. In fact, there are no great indoor GPS-like sensors. People have tried all kinds of things, like triangulating WiFi signals etc., but a cheap and reliable GPS-like sensor that works indoors is still not available at the time of writing. However, it is a good illustrative example to introduce a simple, conditionally Gaussian measurement. Also, it can be a good way to model a more complicated sensor, e.g., a camera-based localization system that uses some type of map.
The measurement model \(h(x_k)\), that predicts the measurement \(z_k\) given the state \(x_k\), will again be a conditional Gaussian. In this example, let us assume the measurement is simply the location of the robot, but with coordinates measured in cm. The measurement model in this case is linear, and we again assume additive noise:
The matrix \(C\) performs a linear transformation on the state, such as converting between different units. Suppose for example that the state is defined in meters and the sensor measures in centimeters. In this case, we could use the \(2\times2\) diagonal matrix \(C=\text{diag}(100,100)\) to apply the appropriate scaling factor to convert from meters to centimeters. Under the assumption that \(w_k\) is again zero-mean, Gaussian noise, the conditional density \(p(z_k|x_k)\) of the measurement \(z_k\) given the state \(x_k\) is then
where \(R\) is the traditional symbol used for measurement model covariance, and \(|R|\) in the denominator denotes the determinant of \(R\). Assuming a fairly inaccurate sensor, with 30cm standard deviation, we have \(R=\text{diag}(30^2,30^2)\) if the uncertainties in the \(x\) and \(y\) directions are independent of one another. Note that the \(2\times 2\) measurement covariance matrix \(R\) is expressed in the units of the measurement, i.e., centimeters, not the units of the state.
4.3.5. Simulating States and Measurements#
Dynamic Bayes nets to the rescue, again!
We can now extend the Gaussian DBN from the previous section to include measurements, so that we can encode the joint density \(p(X,Z|U)\) on states \(X\) and measurements \(Z\), given the controls \(U\):
Let us add the measurement conditionals to the DBN from the previous section to get an extended dynamic Bayes net, as shown in Figure 7.
#| caption: A dynamics Bayes Net for our logistics robot.
#| label: fig:logistics_bayes_net
gaussianBayesNet = gtsam.GaussianBayesNet()
A, B, C = np.eye(2), np.eye(2), 100 * np.eye(2)
motion_model_sigma = 0.2
measurement_model_sigma = 30
for k in indices:
    gaussianBayesNet.push_back(gtsam.GaussianConditional.FromMeanAndStddev(
        z[k], C, x[k], [0, 0], measurement_model_sigma))
for k in reversed(indices[:-1]):
    gaussianBayesNet.push_back(gtsam.GaussianConditional.FromMeanAndStddev(
        x[k+1], A, x[k], B, u[k], [0, 0], motion_model_sigma))
p_x1 = gtsam.GaussianDensity.FromMeanAndStddev(x[1], [20,10], 0.5)
gaussianBayesNet.push_back(p_x1)

position_hints = {'u': 2, 'x': 1, 'z': 0}
show(gaussianBayesNet, hints=position_hints, boxes=set(list(u.values())))

This now allows us to simulate a trajectory and simultaneously simulate a set of measurements:
control_tape = gtsam.VectorValues()
for k, (ux,uy) in zip(indices[:-1], [(2,0), (2,0), (0,2), (0,2)]):
    control_tape.insert(u[k], gtsam.Point2(ux,uy))
gaussianBayesNet.sample(control_tape)
| Variable | value |
|---|---|
| u1 | 2 0 |
| u2 | 2 0 |
| u3 | 0 2 |
| u4 | 0 2 |
| x1 | 20.3525 9.71295 |
| x2 | 21.9712 9.56813 |
| x3 | 23.9742 9.77767 |
| x4 | 23.9099 11.6501 |
| x5 | 23.7314 13.1453 |
| z1 | 2008.52 945.492 |
| z2 | 2211.69 884.474 |
| z3 | 2386.12 950.037 |
| z4 | 2413.53 1149.09 |
| z5 | 2360.21 1289.66 |
4.3.6. GPS-style Likelihoods#
A likelihood is not a probability. A likelihood is not a probability. A likelihood is not a probability.
Let us recall the definition of the likelihood of a state \(x\) from Section 2.4, as being a function proportional to the conditional density of a measurement \(z\), but viewed as a function of \(x\):
The notation emphasizes that the measurement \(z\) is given, and the likelihood is a function defined on the continuous state \(x\).
What is the likelihood function for our GPS-like sensor? That’s easy enough: we take the conditional probability, drop the normalization constant, and view it as a function of the state \(x_k\) rather than the known measurement \(z_k\):
It turns out that in this case (when \(C\) is a square, nonsingular matrix, and \(x_k, z_k \in \mathbb{R}^n\)), the likelihood function looks just like a Gaussian, because we can re-write the above as
which is proportional to a Gaussian density with mean \(C^{-1}z_k\) and covariance matrix \(\Sigma=(C^T R^{-1}C)^{-1}=C^{-1}RC^{-T}\). This actually makes sense: the most likely state \(x_k\) given a measurement \(z_k\) is just the measurement, now divided by 100 to convert to meters, hence the \(C^{-1}\). The covariance is scaled down by 10,000. However, it is important not to go too far and start interpreting this Gaussian-shaped function as a probability: it does not normalize to 1, and it is a coincidence that for linear-conditional Gaussians, the likelihood turns out to be Gaussian-shaped as well.
4.3.7. GTbook 101#
About code defined in gtbook library.
Again we used some code defined in the gtbook library:
logistics.base_map: a 50x100 image with the warehouse shelveslogistics.beacons: an 8x2 array of beacon locations