2.4. Perception#
![]()
Perception is the process of turning sensor measurements in actionable information.

In the previous section we learned about how to model sensors, and how to simulate sensors at work. In this section we want to invert that process: when given one or more measurements, infer what the state might be. As in the previous section, because sensors are not deterministic devices, this inference process will not produce a definitive result, but will at best yield a probability distribution over possible states, given the sensor reading.
In this section, we build up the mathematical machinery for this inference process, beginning with likelihoods, and working our way to full probability distributions that are obtained by fusing data from multiple sensors.
2.4.1. Maximum Likelihood#
Maximum likelihood estimation outputs the state that “agrees” most with the measurement.
Let us revisit the weight sensor from the previous section as an example. We first redefine it in code:
def Gaussian(x, mu=0.0, sigma=1.0):
    return np.exp(-0.5*(x-mu)**2/sigma**2)/np.sqrt(2*np.pi*sigma**2)
# Conditional weight density, mean and standard deviation specified in in grams:
pWC = np.array([[20, 10], [5, 5], [15, 5], [150, 100], [300, 200]])
Now, suppose an unknown object enters the sorting area, and the weight sensor outputs 50 grams. What state is the most likely, given this measurement? One idea is to simply check the conditional probability \(p(\text{Weight}=50|\text{Category})\) value for each of the possible categories. The following piece of code does that for our example:
for index, category in enumerate(categories):
    mu, sigma = pWC[index]
    print(f"{category:12}:{Gaussian(50, mu, sigma):.5f}")
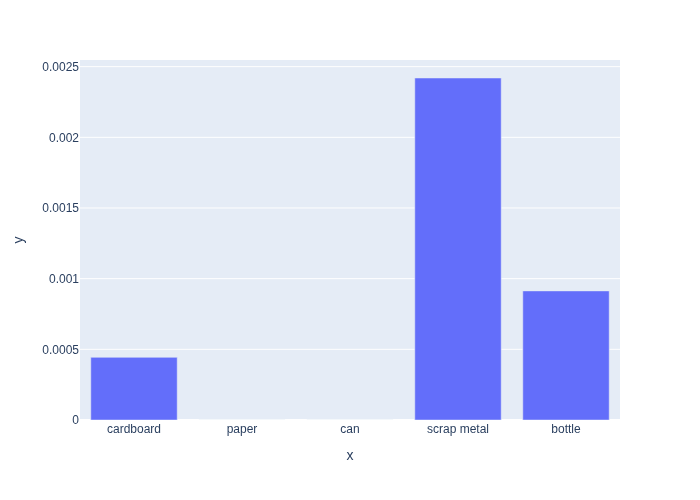
cardboard   :0.00044
paper       :0.00000
can         :0.00000
scrap metal :0.00242
bottle      :0.00091
In the code above, we enumerate all possible categories, and use the index to pick out the parameters of the corresponding conditional Gaussian density. Then we just print it nicely.
We can see that choosing the scrap metal category for the state would accord the highest conditional probability value to the measurement \(weight=50\). We say that scrap metal is the maximum likelihood estimate or ML estimate \(x^*_{ML}\) of the category \(X\) given the measurement \(z\). Formally, we define it as
In other words, we vary the state \(X\) in the conditional probability while keeping the measurement \(Z\) fixed, with known value \(z\), and then select the \(X\) that maximizes the resulting number.
2.4.2. The Likelihood Function#
Likelihoods are not probabilities.
It is convenient to define the likelihood of a state \(X\) given the measurement \(z\) as any function \(L(X;z)\) that is proportional to the conditional density \(p(z|X)\):
The notation above emphasizes that the measurement \(z\) is given, and that the likelihood is a function defined on the state \(X\). This is something many people get confused about. It is the state that is likely or unlikely, not the measurement.
Because of the definition above, the maximum likelihood estimate \(x^*_{ML}\) is equivalently obtained as
Note that the value \(x^*\) that maximizes the value of a function \(f(x)\) also maximizes the value of the function \(\alpha f(x)\) for any constant \(\alpha > 0\), and therefore maximizing \(p(z|X)\) is equivalent to maximizing \(L(X=x;z)\). This is a theme we will encounter quite often: when maximizing (or minimizing) a quantity, we will often not be so concerned with the proportionality constants, which can be expensive to compute.
In Figure 1 we define the likelihood function in code and plot it.
As you can see, when we have a set of discrete categories, even a continuous sensor measurement will induce a discrete likelihood function.
The plot also shows clearly that some categories are more likely than others, and that for a weight of \(50g\), scrap metal is the maximum likelihood estimate.
#| caption: Likelihood of observing a weight of 50g as a function of category.
#| label: fig:likelihood_given_weight
def likelihood_given_weight(weight):
    return np.array([Gaussian(weight, *pWC[index]) for index in range(5)])
L50 = likelihood_given_weight(weight=50)
px.bar(y=L50, x=categories)
It is crucial to understand that the likelihood function \(L(X;z)\) is itself not a probability distribution over the state \(X\). Indeed, if we take the example from above and add the numbers, we get the following:
print(f"sum(L)={sum(L50):.5f}")
sum(L)=0.00378
Since probabilities always sum to one, the likelihood function is clearly not a probability distribution.
2.4.3. Exploring the Likelihood#
With some python notebook magic in Figure 2, we can create a fully interactive applet to explore how the likelihood function changes for different outcomes of the measurement.
#| caption: Interactive plot showing the likelihood.
#| label: fig:interactive_likelihood
@interact(weight=(0, 500, 5))
def show_likelihood(weight=50):
    display(likelihood_figure(weight))
Playing with this interactive applet gives some insight in how the likelihood behaves, and how the ML estimate shifts between categories as the weight measurement changes. We can actually capture this in one convenient graph, by plotting the normalized likelihood function against weight on the x-axis, shown in Figure 3.
def normalized(x):
    Lx = likelihood_given_weight(x)
    return Lx/np.sum(Lx)
X = np.arange(0.0,300)
Y = np.array([normalized(x) for x in X])
#| caption: Normalized likelihood for different weights and categories.
#| label: fig:normalized_likelihood
df = pd.DataFrame(data=Y, index=X, columns=categories, )
px.line(df, )
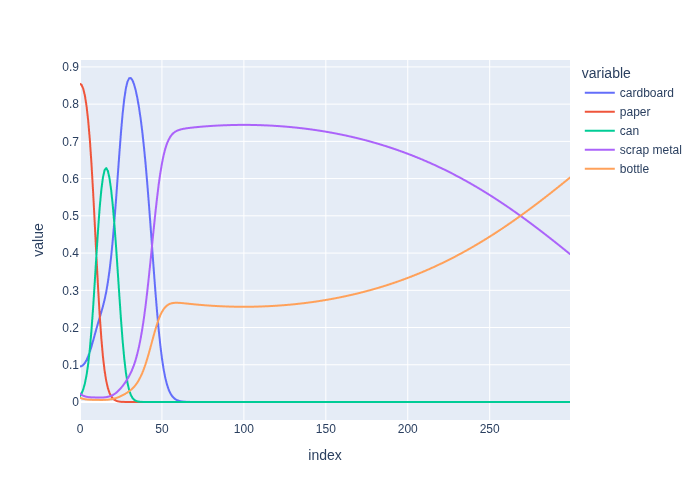
In the figure you can see that, as the weight increases, the maximum likelihood category changes respectively from paper to can to cardboard, then scrap metal wins out for a long interval between approx. \(45g\) and \(270g\), after which finally bottle becomes the MLE above \(270g\). The transition points are known as decision boundaries, and represent the locations in measurement space where our ML estimator changes its estimate.
Note: we will see below that normalizing as we did here corresponds to assuming we have no a priori knowledge about the category distribution, which is of course incorrect for our trash sorting example.
2.4.4. Likelihood with Discrete Sensors#
Of course, we can also define the likelihood of the category given the output of a discrete sensor. For example, let us redefine the “detector” sensor model from the previous section. First, as before, we model it using a conditional probability distribution:
pDT = gtsam.DiscreteConditional(
    Detection, [Category], "2/88/10 2/20/78 33/33/34 33/33/34 95/2/3")
pretty(pDT)
P(Detection|Category):
| Category | bottle | cardboard | paper |
|---|---|---|---|
| cardboard | 0.02 | 0.88 | 0.1 |
| paper | 0.02 | 0.2 | 0.78 |
| can | 0.33 | 0.33 | 0.34 |
| scrap metal | 0.33 | 0.33 | 0.34 |
| bottle | 0.95 | 0.02 | 0.03 |
After that, the likelihood functions correspond to the columns above: one column for each possible detection outcome. Again, note that these likelihood functions do not sum to 1.0; the rows sum up to 1.0, but the columns do not.
2.4.5. Likelihood Factors#
We can use a factor to represent the likelihood of an unknown state.
All of the perception algorithms in this book will heavily depend on likelihood functions, and we now
introduce a special data structure to conveniently represent them in code. For the Gaussian measurement model, we can instantiate a DecisionTreeFactor with the likelihood function we calculated above for the weight sensor:
weight_50_factor = gtsam.DecisionTreeFactor(
    Category, likelihood_given_weight(50))
pretty(weight_50_factor)
| Category | value |
|---|---|
| cardboard | 0.000443185 |
| paper | 2.05595e-19 |
| can | 1.82694e-12 |
| scrap metal | 0.00241971 |
| bottle | 0.000913245 |
Formally, a factor \(\phi(X)\) is simply a function from outcomes \(x\) to the real numbers, and hence we can use it to represent the likelihood of all possible outcomes, given a measurement \(z\). When used in this way, we call \(\phi\) a likelihood factor and we make the dependence on \(z\) explicit by writing
in analogy with the likelihood function \(L(X; z)\). To distinguish likelihood factors derived from different sensors, we use a subscript, e.g., the weight-derived likelihood factor we derived above might be written like so:
Let us now define the likelihood factor \(\phi(\text{Category}; \text{Detection})\) for the discrete detection factor. In GTSAM, a DiscreteConditional class actually has a handy likelihood method by which we can pick out the column. e.g., corresponding to the cardboard detection:
detector_outcomes = ["bottle", "cardboard", "paper"]
index = detector_outcomes.index("cardboard")  # 1 is the index for "cardboard"
detected_cardboard_factor = pDT.likelihood(index)
pretty(detected_cardboard_factor)
| Category | value |
|---|---|
| cardboard | 0.88 |
| paper | 0.2 |
| can | 0.33 |
| scrap metal | 0.33 |
| bottle | 0.02 |
Figure 4 shows a small interactive applet that allows us to examine the likelihood factor for every possible detection outcome. Note that we use the built-in index function to translate detection outcomes to an integer index:
#| caption: The likelihood of observing a category given a detection.
#| label: fig:likelihood_given_detection
@interact(detection=detector_outcomes)
def show_likelihood(detection="bottle"):
    index = detector_outcomes.index(detection)
    L_index = [v for (k,v) in pDT.likelihood(index).enumerate()]
    display(px.bar(x=L_index, y=categories))
Picking out the most likely category only gets us so far, however: it is not clear how we might fuse multiple sensor measurements, or how to incorporate prior information. In fact, we can do better… we can use Bayes’ theorem to accomplish both goals. We will do so below, after first explaining the concept of joint distributions.
2.4.6. Joint Distribution#
A joint probability distribution allows us to calculate the probability of two or more variables co-occurring.
Let us consider again a sensor model \(P(X|Z)\), where until now we viewed the variable \(Z\) as a parameter. If we instead treat the parameter \(Z\) not as a known parameter but as an unknown variable itself, with probability distribution \(P(Z)\), we obtain a joint probability distribution over the pair of variables \(X\) and \(Z\), and its PMF is given by the chain rule:
To sample from a joint distribution \(P(X,Z)\), we first sample a value \(z\) from \(P(Z)\), as it does not depend on any other variable, and then sample a value \(x\) from the conditional distribution \(P(X|z)\).
As an example, let us calculate the joint probability of Detection and Conductivity:
pCT = gtsam.DiscreteConditional(
    Conductivity, [Category], "99/1 99/1 10/90 15/85 95/5")
category_prior = gtsam.DiscreteDistribution(Category, "200/300/250/200/50")
joint = pCT * category_prior
pretty(joint)
P(Conductivity,Category):
| Conductivity | Category | value |
|---|---|---|
| false | cardboard | 0.198 |
| false | paper | 0.297 |
| false | can | 0.025 |
| false | scrap metal | 0.03 |
| false | bottle | 0.0475 |
| true | cardboard | 0.002 |
| true | paper | 0.003 |
| true | can | 0.225 |
| true | scrap metal | 0.17 |
| true | bottle | 0.0025 |
The table above is the result of applying the chain rule
and contains \(10=2*5\) entries. A quick check validates that all entries sum up to \(1.0\), i.e., this is truly a probability distribution over the product space \(\{\text{True}, \text{False}\} \times \{\text{cardboard}, \text{paper}, \text{can}, \text{scrap metal}, \text{bottle}\}\):
assert sum(p for _, p in joint.enumerate()) == 1.0
2.4.7. Marginal Distributions#
We can project a joint distribution onto its individual variables.
Given a joint probability distribution \(P(X,Z)\) for discrete random variables \(X\) and \(Z\), we can determine the probability of an outcome \(x\) for \(X\), irrespective of the value of \(Z\). We call this the marginal probability distribution of \(X\), and it can be calculated as
and of course we can also calculate the marginal distribution of \(Z\), in the same way:
GTSAM has built-in functions to project joint distributions onto their marginals. For example, if we calculate the marginal \(P(\text{Category})\) we simply get the prior on Category back:
pCat = joint.marginal(Category[0]) # Note marginal takes an id, not a tuple
pretty(pCat)
P(Category):
| Category | value |
|---|---|
| cardboard | 0.2 |
| paper | 0.3 |
| can | 0.25 |
| scrap metal | 0.2 |
| bottle | 0.05 |
However, if we marginalize to the Conductivity variable, we instead recover the probabilities that the conductivity sensor will return True or False, regardless of the category. We see that in about \(60\%\) of the cases the conductivity sensor should return False:
pCon = joint.marginal(Conductivity[0]) # Note marginal takes an id, not a tuple
pretty(pCon) # Note marginal takes an id, not a tuple
P(Conductivity):
| Conductivity | value |
|---|---|
| false | 0.5975 |
| true | 0.4025 |
We can also calculate the conditional distributions when given the joint distribution, by taking the joint probability distribution and dividing by the appropriate marginal (assuming those are non-zero!):
This is really just the chain rule, rearranged.
In code, this is implemented by a special constructor for DiscreteConditional, taking joint and marginal
distributions, respectively. For example, the following piece of code recovers our conductivity sensor model from the joint distribution, by implementing
p_Conductivity_given_Category = gtsam.DiscreteConditional(joint, pCat)
pretty(p_Conductivity_given_Category)
P(Conductivity|Category):
| Category | false | true |
|---|---|---|
| cardboard | 0.99 | 0.01 |
| paper | 0.99 | 0.01 |
| can | 0.1 | 0.9 |
| scrap metal | 0.15 | 0.85 |
| bottle | 0.95 | 0.05 |
2.4.8. Bayes’ Theorem#
Bayes’ theorem says that the posterior is the likelihood times the prior.
Given the formulas we discussed above, we can now derive Bayes’ theorem, which allows us to infer knowledge about a variable, say the robot state \(X\), given an observed sensor value \(z\). The theorem is named after the Reverend Thomas Bayes, an eighteenth century minister who took an interest in probability later in life. He also lends his name to the Bayes nets that we discuss in the next chapter.
Bayes’ theorem allows us to calculate the posterior probability distribution \(P(X|Z=z)\) on the variable \(X\) given an observed value for \(Z\). When applying Bayes’ theorem we use the term “prior” to indicate knowledge we have about a variable \(X\) before seeing evidence for it, and use the term “posterior” to denote the knowledge after having incorporated evidence. In our case, the evidence is the observed value \(z\). To calculate the posterior, the elements we need are a prior probability distribution \(P(X)\), a conditional probability distribution \(P(Z|X)\) modeling the measurement, and the value \(z\) itself. Given these elements, we can calculate the posterior probability distribution on \(X\):
The proof is simple and involves applying the chain rule in two ways:
As we have already seen, because the observation is known, we can use the definition of the likelihood function \(L(X;z)\propto P(Z=z|X)\) and substitute that into the expression above. In addition, note that above the quantity \(P(Z=z)\) simply acts as a normalization constant. Given these two facts, we can state Bayes’ theorem in a more intuitive, and easier to remember way as
or “the posterior is proportional to the likelihood weighted by the prior.”
Finally, when actually computing a posterior there is not even a need to think about anything but the joint distribution. Indeed, because by the chain rule we have \(P(Z=z|X)P(X)=P(X,Z=z)\), and because \(P(Z=z)\) is just a normalization factor, we obtain a third form of Bayes’ theorem, which is the simplest of all:
Hence, if we are given a formula or table of joint probability entries \(P(X,Z)\), it suffices to just select all entries for which \(Z=z,\) normalize, and voilà!
2.4.9. MAP Estimation#
We combine likelihoods with the prior into a posterior, via Bayes’ theorem.
We are now finally in a position to optimally calculate everything we know about a “hidden” state \(X\), given and observed sensor measurement \(z\). In GTSAM, we simply combine a likelihood factor \(\phi(X; z)\) with a prior \(P(X)\) on the unknown variable \(X\). This immediately yields a probability distribution over all category detector_outcomes.
The maximum a posteriori or MAP estimate \(x^*_{MAP}\) for the variable \(X\) is the value which maximizes the posterior \(P(X|z)\), i.e.,
For example, let’s assume that the conductivity sensor measured False, what is then our knowledge about Category? The code creates the factor, multiplies it with the prior, and displays the result as a (pretty) table:
conductivity_false_factor = pCT.likelihood(0)
pretty(conductivity_false_factor)
| Category | value |
|---|---|
| cardboard | 0.99 |
| paper | 0.99 |
| can | 0.1 |
| scrap metal | 0.15 |
| bottle | 0.95 |
unnormalized_posterior = conductivity_false_factor * category_prior
print(type(unnormalized_posterior))
print(sum(p for _, p in unnormalized_posterior.enumerate()))
pretty(unnormalized_posterior)
<class 'gtsam.gtsam.DecisionTreeFactor'>
0.5975
| Category | value |
|---|---|
| cardboard | 0.198 |
| paper | 0.297 |
| can | 0.025 |
| scrap metal | 0.03 |
| bottle | 0.0475 |
Above, we also printed out the type (a DecisionTreeFactor) and the sum of the product, which does not sum up to 1.0! Indeed, the product of a factor with a conditional yields another factor, which is the unnormalized posterior, i.e., the right-hand-side in the second form of Bayes’ theorem.
Note that we do not need to normalize to see that the MAP category, given our prior knowledge and a False conductivity measurement is paper. However, it would be nice to see the actual probability detector_outcomes. This can be done by normalizing, which in GTSAM is easiest by converting the factor to a DiscreteDistribution, like so:
posterior = gtsam.DiscreteDistribution(unnormalized_posterior)
print(type(posterior))
assert sum(p for _, p in posterior.enumerate()) == 1.0
pretty(posterior)
<class 'gtsam.gtsam.DiscreteDistribution'>
P(Category):
| Category | value |
|---|---|
| cardboard | 0.331381 |
| paper | 0.497071 |
| can | 0.041841 |
| scrap metal | 0.0502092 |
| bottle | 0.0794979 |
Now we can more easily appreciate the relative posterior probabilities. The paper category was already the most probable category a priori, at \(30\%\), and the negative conductivity measurement strengthened our belief in this outcome to almost \(50\%\).
In contrast, if we would have had a positive conductivity measurement, we would obtain a very different result:
Cat_given_Con1 = gtsam.DiscreteDistribution(pCT.likelihood(1) * category_prior)
assert sum(p for _, p in Cat_given_Con1.enumerate()) == 1.0
pretty(Cat_given_Con1)
P(Category):
| Category | value |
|---|---|
| cardboard | 0.00496894 |
| paper | 0.00745342 |
| can | 0.559006 |
| scrap metal | 0.42236 |
| bottle | 0.00621118 |
Now the can category is the MAP estimate, and the posterior probability for cardboard is almost \(0\%\). The reason is because the likelihood of paper given positive conductivity is very low (check it!).
2.4.10. Fusing Multiple Measurements#
Bayes’ theorem can easily accommodate multiple measurements as well.
Applying Bayes’ theorem to the joint measurement \((z_z, z_2)\) gives
where the likelihood function is defined as
Often sensor measurements are conditionally independent given the state variable \(X\). Mathematically, the outcomes \(Z_1\) and \(Z_2\) are conditionally independent given \(X\) if
Conditional independence often occurs when two sensors both depend on the same aspects of the state. In such cases, when the state is not known, information about \(Z_1\) might be informative regarding possible values of \(Z_2\), but once the state is known, knowing the value of \(Z_1\) will not influence our belief about what to expect for \(Z_2\).
When \(Z_1\) and \(Z_2\) are conditionally independent given \(X\), the likelihood function factors into a product:
Hence, Bayes’ theorem simply becomes
In other words, the posterior is proportional to the product of the likelihoods weighted by the prior. This result generalizes to an arbitrary number of sensor measurements, provided they are conditionally independent given the value of the variable \(X\).
It is important to note that conditional independence applies only when the value of \(X\) is known. Unless the sensors are statistically independent, i.e., \(P(Z_1, Z_2) = P(Z_1) P(Z_2)\), if \(X\) is not known, sensor measurements are not independent. In Equation 19, the variable \(X\) always appears behind the conditioning bar, which is our way of saying “given a known category”.
As our last example in this section, given the above generalized Bayes’ theorem, we can finally fuse the information from the three measurements into a posterior over the category. For example, given a weight of \(50g\), a False conductivity measurement, and the detector saying cardboard, we obtain the following for the likelihood,
likelihood = weight_50_factor * conductivity_false_factor * detected_cardboard_factor
pretty(likelihood)
| Category | value |
|---|---|
| cardboard | 0.000386103 |
| paper | 4.07079e-20 |
| can | 6.02892e-14 |
| scrap metal | 0.000119776 |
| bottle | 1.73517e-05 |
and, after multiplying with the prior and normalizing, the following posterior:
posterior = gtsam.DiscreteDistribution(likelihood * category_prior)
pretty(posterior)
P(Category):
| Category | value |
|---|---|
| cardboard | 0.756743 |
| paper | 1.19678e-16 |
| can | 1.47705e-10 |
| scrap metal | 0.234754 |
| bottle | 0.00850212 |
We see that cardboard is the MAP estimate, with \(76\%\) probability, but considerable probability (\(23\%\)) is assigned to scrap metal as well. Note that just looking at the likelihood we could have already guessed that cardboard is very likely (in fact, it is the ML estimate), but the prior makes it an even more probable outcome (check this!).
The interactive applet in Figure 5 creates a function to calculate the posterior for any measurement combination, and allows you to explore the posterior in the discrete-continuous measurement space.
def posterior(conductivity, detection, weight):
    """Calculate posterior for any measurement combination."""
    conductivity_factor = pCT.likelihood(conductivity)
    detector_factor = pDT.likelihood(detector_outcomes.index(detection))
    weight_factor = gtsam.DecisionTreeFactor(
        Category, likelihood_given_weight(weight))
    Px = gtsam.DiscreteDistribution(
        conductivity_factor* detector_factor * weight_factor * category_prior)
    return Px.pmf()
#| caption: Interactive plot showing the posterior.
#| label: fig:interactive_posterior
@interact(conductivity=[0,1], detection=detector_outcomes)
def show_posterior(conductivity=0, detection="paper"):
    X = np.arange(0.0, 300)
    Y = np.array([posterior(conductivity, detection, weight) for weight in X])

    # make use of pandas/plotly integration for pretty graph:
    df = pd.DataFrame(data=Y, index=X, columns=categories, )
    display(px.line(df))
2.4.11. GTSAM 101#
The GTSAM concepts used in this section, explained.
2.4.11.1. Factors#
Above we created an instance of the DecisionTreeFactor class. As with any GTSAM class, you can type
help(gtsam.DecisionTreeFactor)
to get documentation on its constructors and methods. In particular, we called the constructor
  __init__(self: gtsam.DecisionTreeFactor,
           key: Tuple[int, int],
           spec: List[float]) -> None
which expects two arguments (besides self, which you can ignore):
keys: A list of (id, cardinality) tuples, specifying the variables.spec: A list of floats. There should be as many PMFs as there are different assignments to the variables.
The constructor above was used to create likelihood factors for the continuous weight sensor. We also directly created a likelihood factor from a DiscreteConditional, by invoking its likelihood method:
likelihood(self: gtsam.DiscreteConditional, value: int) -> gtsam.DecisionTreeFactor
which takes an integer index value corresponding to an assignment to the variable on which this conditional was defined, in our case the Detection measurement.
The factors we created above are of type DecisionTreeFactor, which are stored as decision trees:
#| caption: Decision tree in a `DecisionTreeFactor`.
#| label: fig:decision_tree_factor
show(conductivity_false_factor)

2.4.11.2. Enumerate and DiscreteValues#
Above we also used the enumerate method:
enumerate(self: gtsam.DecisionTreeFactor) -> List[Tuple[gtsam::DiscreteValues, float]]
which yields a list of DiscreteValues assignments and the factor value corresponding to that assignment. E.g.:
conductivity_false_factor.enumerate()
[(DiscreteValues{2: 0}, 0.99),
 (DiscreteValues{2: 1}, 0.99),
 (DiscreteValues{2: 2}, 0.1),
 (DiscreteValues{2: 3}, 0.15),
 (DiscreteValues{2: 4}, 0.95)]
We have discussed the DiscreteValues type above in detail in Section 2.3.
2.4.11.3. Conditional and Factor Products#
Discrete conditionals and factors support multiplication by overloading the * operator. There are some rules, though:
conditional * conditional -> conditional
factor * conditional -> factor
conditional * factor: not allowed!
We used (1) to create joint distributions, and (2) to implement Bayes’ theorem. Option (3) is currently not allowed in GTSAM and will throw an error.