6.4. SLAM#
![]()
SLAM is Simultaneous Localization and Mapping, a key capability for mobile robots.
When an autonomous vehicle explores a new environment, it should be able to simultaneously build a map of this environment, and localize itself relative to that map. That capability is known as Simultaneous Localization and Mapping or SLAM. SLAM is a bit like a chicken and egg problem: if we knew the map, we could use the localization techniques we studied in Section 4.4, e.g., Monte Carlo Localization. Conversely, if we were already localized, it would not be too hard to create a map: if we have a LIDAR sensor, we could simply transform the points from the LIDAR frame into the world frame. But now we have to do both at the same time! Is that even possible?
In this section we show that this is possible, and we introduce two different SLAM techniques: PoseSLAM and SLAM with landmarks. In the former we concentrate on estimating the robot’s motion from a rich sensor such as LIDAR, and building the map is accomplished as a side effect. In the latter, we truly optimize for both the location of the vehicle and the location of a observed landmarks, which leads to a sparse map of the environment. Before investigating these two SLAM algorithms, we review the math of vehicle poses in 2D, and discuss ICP, a seminal algorithm for aligning two point clouds, and which we use as a building block in PoseSLAM.
6.4.1. Poses in 2D and 3D#
SE(2) generalizes to SE(3).
In both SLAM variants we need to optimize over the pose of a vehicle. To keep things simple, we will concentrate on poses in the plane for now. Recall from Section 6.1 that a 2D pose \(T\) is an element of the Special Euclidean group \(SE(2)\), and can be represented by a \(3\times3\) matrix of the form
with the \(2\times1\) vector \(t\) representing the position of the vehicle, and \(R\) the \(2\times2\) rotation matrix representing the vehicle’s orientation in the plane.
Below it is important to understand what coordinate frames are involved, and hence we insist on always annotating the transformation matrices with indices indicating the reference frame as superscript and the frame under consideration using subscript. This convention also provides a reminder of how points in one frame are transformed into the other. As an example, the following illustrates how points in the frame \(b\) are transformed into the reference frame \(a\) by referring to the pose \(T^a_b\) of frame \(b\) in \(a\),
where as before \(\tilde P\) denotes the homogeneous coordinates of the point \(P\). A good rule to keep in mind, illustrated above, is that the superscript \(b\) of the point \(\tilde P^b\) on the right-hand side is “canceled” by the subscript \(b\) in the pose \(T^a_b\), and so the left-hand side \(\tilde P^a\) only retains the superscript \(a\), indicating it now lives in the reference frame \(a\). This rule is quite useful when implementing these types of transformations in code, as well. Also, keep in mind that we are talking about the same point \(P\) in both cases: it is simply the coordinates that change by expressing them in a different frame.
Note that this representation generalizes easily to three dimensions, but of course \(t^a_b\) will be a three-vector, and \(R^a_b\) will be a \(3\times3\) rotation matrix representing the 3D orientation of the vehicle. The latter can be decomposed into roll, pitch, and yaw, if so desired, but we will not need that until the next chapter.
6.4.2. The Iterative Closest Points Algorithm#
ICP is a seminal method to align two point clouds.
Iterative closest points or ICP is a method to align two point clouds, e.g., two successive LIDAR scans, and it is a crucial component in the PoseSLAM algorithm we will discuss next. Leaning into the notation re-introduced above, we use superscripts \(a\) and \(b\) to distinguish the two point clouds, and the points therein. Under the assumption that we have a good initial estimate \(\hat{T^a_b}\) for the relative pose \(T^a_b\) between the two point clouds, ICP iterates between two steps:
Find closest point correspondences between the two clouds.
Use these point correspondences to re-estimate the relative pose \(\hat{T^a_b}\) between the two point clouds.
These two steps are iterated until convergence, hence the name iterative closest points. Below we explain both steps in more detail.
6.4.2.1. Finding Closest Points#
The first step is the easiest: for each point \(P^a_j\) in the first point cloud, we define \(P^b_j\) to be its closest point in the second point cloud. Stated formally, for each point \(P^a_j\), we solve the following minimization problem:
We prefer using indices \(j\) for points as we use \(i\) for poses below, making it easier to associate notation with geometric concepts. Two things about the above minimization are worth noting: (a) it can be solved using a linear search over all points \(P^b\), and (b) rather than computing the distance we can save the computation of a square root by minimizing the square, which is just as good as they are monotonically related.
The linear search problem above is known as the nearest neighbor problem, and solving this problem for all points is the all nearest neighbors problem. Iterating over all points in the second cloud can be quite slow, and indeed finding all nearest neighbors that way has quadratic complexity. However, very fast approximate nearest neighbor algorithms are available. Many of these use specialized data structures, such as KD-trees in 2D or Octrees in 3D. While the details are beyond the scope of this book, intuitively these data structures recursively divide up the point clouds into sub-clouds, such that sub-clouds unlikely to contain the nearest neighbor can be quickly excluded. We build this data structure once for the second cloud, and then use it for all nearest neighbor searches, leading to complexity which is approximately \(O(N \log N\)), for point clouds of size \(N\).
6.4.2.2. Estimating the Pairwise Transform#
The second step is the more interesting one: given a set of closest point pairs \(\{(P^a_j, P^b_j)\}\), how can we estimate the relative pose \(\widehat{T^a_b}\) between the two point clouds? This is known as the pose alignment problem.
Let us first assume that the two point clouds only differ by a rotation \(R^a_b\). When this is the case, and assuming we have corresponding points \(P^a\) and \(P^b\), then each point \(P^a\) in the first cloud can be expressed as a function of a point \(P^b\) in the second cloud:
One might be tempted to think that therefore
but, of course, since \(P^b\) is a vector, it does not have an inverse. So this would not work. Interestingly, though, if we form the matrix
by summing over at least 3 point pairs \((P^a_j, P^b_j)\), it turns out that the rotation matrix \(\widehat{R^a_b}\) closest to \(H\) in the least squares sense is the best possible estimate for the unknown rotation \(R^a_b\). In addition, using the singular value decomposition from linear algebra, it is very easy to compute.
The singular value decomposition of the matrix \(H\) is defined by \(H=U\Lambda V^T\), in which \(\Lambda\) is a diagonal matrix of singular values, and both \(U\) and \(V\) are orthogonal matrices. The optimal estimate for the rotation matrix is given by
Interesting aside: this problem is known as the orthogonal Procrustes problem and its solution via SVD has been known since 1966, from a 1966 paper by Peter Schönemann [Schoenemann, 1966]. Procrustes was a mythological greek villain who either stretched or cut his victims to size to fit their bed, analogous to how we make the rotation matrix above fit the data.
The above solves the problem when there is only rotation, but we must also consider relative translation between the two point clouds. Fortunately, it turns out that the best possible translation estimate will always align the centroids of the two point clouds. Hence, when there is translation present, we simply compute the matrix \(H\) from the centered points,
where the point cloud centroids \(C^a\) and \(C^b\) are computed as
Given the estimated rotation \(\widehat{R^a_b}\), the translation estimate \(\widehat{t^a_b}\) can then be estimated from
and the final relative pose estimate is given by \(\widehat{T^a_b} =(\widehat{R^a_b}, \widehat{t^a_b})\). By the way, all of the above math is identical for both the 2D and 3D case.
6.4.3. PoseSLAM#
PoseSLAM is SLAM with pose priors and relative pose constraints only. We can derive those from Iterative Closest Points (ICP).
As we discussed at the beginning of this section, in SLAM the goal is to localize a robot using the information coming from the robot’s sensors, while simultaneously building the map. We have already covered the localization problem in chapter 4, using Markov localization, Monte Carlo localization, and the Kalman filter. The additional wrinkle in SLAM is that we do not know the map a priori, and hence we have to infer the unknown map while simultaneously estimating the robot’s location with respect to the evolving map.
PoseSLAM is a variant of SLAM that uses pose constraints (using an algorithm such as ICP) as a basic building block when optimizing over the unknown vehicle poses. In PoseSLAM we do not explicitly optimize over a map. Instead the map is reconstructed after the fact. This can only work if (a) the sensor is sufficiently rich to make the pose constraints very accurate, and (b) we can build a sufficiently good map using this sensor data. LIDAR satisfies both of these assumptions, making LIDAR-based PoseSLAM a very popular technique.
In a nutshell, the PoseSLAM problem can be stated as:
Given a set of noisy relative measurements or pose constraints \(\tilde{T}_{ij}\), recover the optimal set of poses \(T_{i}^{*}\) that maximizes the posteriori probability, i.e., recover the MAP solution.
In the case of mapping for autonomous driving, these relative measurements can be derived by performing ICP between overlapping LIDAR scans. If available, we can additionally use GPS and/or IMU measurements to decide which scans overlap, so that we do not have to do this \(O(n^{2})\) times. Depending on the situation, we can optimize for 3D or 2D poses, in the way we will discus below. Afterwards, we can reconstruct a detailed map by transforming the local LIDAR scans into the world frame, using the optimized poses \(T_{i}^{*}\).
6.4.4. The PoseSLAM Factor Graph#
Factor graphs expose the sparse set of constraints tying absolute poses together.
In our factor-graph view of the world, a pose constraint is represented as a factor. As before, the factor graph represent the posterior distribution over the unknown pose variables \(\mathcal{T}=\{X_{1}\dots X_{5}\}\) given the known measurements:
where \(\mathcal{T}_{i}\) is the set of poses involved with factor \(\phi_i\). In this way, the factor graph encodes which factors are connected to which variables, exposing the sparsity pattern of the corresponding estimation problem.

An example is shown in Figure 1. The example represents a vehicle driving around, and taking LIDAR scans at 5 different world poses, represented by \(T_{1}\) to \(T_{5}\). The factors \(f_{1}\) to \(f_{4}\) are binary factors representing the pose constraints obtained by matching successive LIDAR scans using ICP.
The factor \(f_{5}(T_{5},T_{2})\) is a so-called loop closure constraint: rather than derived from two successive scans, this one is derived from matching the scan taken at \(T_{5}\) with the one at \(T_{2}\). Detecting such loops can be done through a variety of means. The final, unary factor \(f_{0}(T_{1})\) is there to “anchor” the solution to the origin: if it is not there, the solution will be undetermined. Another way to anchor the solution is to add unary factors at every time-step, derived from GPS.
6.4.5. MAP Inference via Least Squares#
Linear problems with zero-mean Gaussian noise lead to least-squares problems.
When measurements are linear functions of continuous variables, finding the maximum a posteriori (MAP) solution can be done via least-squares optimization. Earlier in this book we have discussed MAP inference for discrete variables, and we have discussed probability distributions for continuous variables, but we have never put the two together.
In the case of linear measurements corrupted by zero-mean Gaussian noise, we can recover the MAP solution by minimizing a sum of squared differences. Recall that a univariate Gaussian density with mean \(\mu\) and variance \(\sigma^{2}\) is given by
An example can help explain this more clearly. In particular, if we focus our attention in PoseSLAM on just the x coordinates. Let us denote the relative measurements \(\tilde{x}_{ij}\), predicted by
and, taking \(\sigma=1\) for now, each factor in Figure 1 could be written as
By taking the negative log, maximizing the posterior corresponds to minimizing the following sum of squares, where the sum ranges over all \((i,j)\) pairs for which we have a pairwise measurement:
The minimization is over the set of all unknown poses \(\mathcal{X}\doteq\{x_i\}\) and yields the MAP estimate \(\mathcal{X}^{*}\) for the poses.
Linear least-squares problems like these are easily solved by numerical
computing packages like MATLAB or numpy.
6.4.6. PoseSLAM is Nonlinear !#
Nonlinear problems need nonlinear solutions.
Unfortunately, in the PoseSLAM case we cannot use linear least squares, because poses are not simply vectors, and the measurements are not simply linear functions of the poses. Indeed, in PoseSLAM both the prediction \(h(T_{i},T_{j})\) and the measurement \(\tilde{T}_{ij}\) are relative poses. The measurement prediction function \(h(\cdot)\) is given by the relative transformation \(T_ij \doteq T_{i}^{-1}T_{j}\):
Hence, the measurement error to be minimized is
where \(\log:SE(2)\rightarrow\mathbb{R}^3\) is a variation of the logarithm function that maps a pose in \(SE(2)\) to a three-dimensional local coordinate vector \(\xi\). We will describe this in more detail below.
There are two ways to deal with this nonlinear problem. The first is to realize that the only nonlinearities stem from the \(\sin\) and \(\cos\) that are associated with the unknown orientations \(\theta_{i}\). Recognizing this, we could try to solve for the orientations first, and then solve for the translations using linear least squares, exactly as above. This approach is known as rotation averaging followed by linear translation recovery. Unfortunately this approach is suboptimal, as it does not consider the orientation and translation simultaneously. However, it can serve to provide a (very) good initial estimate for nonlinear optimization, discussed below.
Indeed, we will prefer to take a second route, which is to use nonlinear optimization, which we discuss below.
6.4.7. Nonlinear Optimization for PoseSLAM#
Linearize, solve, repeat…
At first glance, minimizing the measurement error might seem to be a straightforward nonlinear optimization problem: simply use your favorite nonlinear optimizer, e.g., with an initial estimate provided using the method in the previous section. This approach might well succeed in finding matrices \(T_i\) that minimize the error, but, unfortunately, there is no guarantee that \(T_i \in SE(2)\), since this approach does not ensure that the upper left submatrix is a valid rotation matrix.
Instead, we will locally linearize the problem and solve the corresponding linear problem using least squares, and iterate this until convergence. We do this by, at each iteration, parameterizing a pose \(T\) by
where \(\xi \doteq (\delta x,\delta y,\delta\theta)\) is a 3-vector of local coordinates, and the incremental pose \(\Delta(\xi)\in SE(2)\) is defined as
which you can recognize as a small angle approximation of the \(SE(2)\) matrix, since \(\cos \theta \approx 1\) and \(\sin \theta \approx \theta\) for small \(\theta\).
In 3D the local coordinate vector \(\xi\) is 6-dimensional, and the small angle approximation is defined as
with \(\xi \doteq (\theta_{x},\theta_{y},\theta_{z},\delta x,\delta y,\delta z)\). It is well known that in this case we can also approximate the nonlinear error by the following linear approximation:
For \(SE(2)\) the matrices \(A_{i}\) and \(A_{j}\) are the \(3\times3\) Jacobian matrices and \(b\) is a \(3\times1\) bias term. The above provides a linear approximation of the term within the norm as a function of the incremental local coordinates \(\xi_{i}\) and \(\xi_{j}\). Deriving the detailed expressions for these Jacobians is beyond the scope of this book, but suffice to say that they exist and are not too expensive to compute. In three dimensions, the Jacobian matrices are \(6\times6\) and \(16\times6\), respectively.
The final optimization will—in each iteration—minimize over the local coordinates of all poses by summing over all pose constraints. If we index those constraints by \(k\), we have the following least-squares problem:
where \(\Xi\doteq \{ \xi_{i}\}\), the set of all incremental pose coordinates. After solving for the incremental updates \(\Xi\), we update all poses using
with \(\Delta(\xi_i)\) defined as in (6.54).
We then check for convergence: if the error does not decrease significantly we terminate, otherwise we linearize and solve again, until the error converges. While this is not guaranteed to converge to a global minimum, in practice it does so if there are enough relative measurements and a good initial estimate is available. For example, GPS can provide us with a good initial estimate. However, especially in urban environments GPS can be quite noisy, and it could happen that the map quality suffers by converging to a bad local minimum. Hence, a good quality control process is absolutely necessary in production environments.
In summary, the algorithm for nonlinear optimization is
Start with an initial estimate \(\mathcal{T}^{0}\)
Iterate:
Linearize the factors \(\frac{1}{2}\Vert \log(\tilde{T}_{ij}^{-1}T_{i}^{-1}T_{j})\Vert ^{2}\approx\frac{1}{2}\Vert A_{i}\xi_{i}+A_{j}\xi_{j}-b\Vert ^{2}\)
Solve the least-squares problem \(\Xi^{*}=\arg\min_{\Xi}\sum_{k}\frac{1}{2}\Vert A_{ki}\xi_{i}+A_{kj}\xi_{j}-b_{k}\Vert ^{2}\)
Update \(X_{i}^{t+1}\leftarrow X_{j}^{t}\Delta(\xi_{i})\)
Until the nonlinear error \(\sum_{k}\frac{1}{2}\Vert \log(\tilde{T}_{ij}^{-1}T_{i}^{-1}T_{j})\Vert ^{2}\) converges.
6.4.8. Optimization with GTSAM#
GTSAM rocks PoseSLAM.
For SLAM we typically use specialized packages such as GTSAM that exploit the sparsity of the factor graphs to dramatically speed up computation. Typically measurements only provide information on the relationship between a handful of variables, and hence the resulting factor graph will be sparsely connected. This is exploited by the algorithms implemented in GTSAM to reduce computational complexity. Even when graphs are too dense to be handled efficiently by direct methods, GTSAM provides iterative methods that are quite efficient.
The code in Figure 2, included in GTSAM as an example, creates the factor graph from Figure 1. The first block of code creates a nonlinear factor graph and adds the unary factor \(f_{0}(T_{1})\). As the vehicle travels through the world, it adds binary factors \(f_{t}(T_{t},T_{t+1})\) corresponding to odometry measurements. Note that the final line of code models a different event: a loop closure. For example, the vehicle might recognize the same location using vision or a laser range finder, and calculate the geometric pose constraint to when it first visited this location. This is illustrated for poses \(T_{5}\) and \(T_{2}\), and generates the (red) loop closing factor \(f_{5}(T_{5},T_{2})\).
#| caption: Code to re-create the factor graph from Figure [1](#fig:PoseSLAMFG).
#| label: fig:createPoseSLAMFG
graph = gtsam.NonlinearFactorGraph()
prior_model = gtsam.noiseModel.Diagonal.Sigmas((0.3, 0.3, 0.1))
graph.add(gtsam.PriorFactorPose2(1, gtsam.Pose2(0, 0, 0), prior_model))

# Create odometry (Between) factors between consecutive poses
odometry_model = gtsam.noiseModel.Diagonal.Sigmas((0.2, 0.2, 0.1))
Between = gtsam.BetweenFactorPose2
graph.add(Between(1, 2, gtsam.Pose2(2, 0, 0), odometry_model))
graph.add(Between(2, 3, gtsam.Pose2(2, 0, np.pi/2), odometry_model))
graph.add(Between(3, 4, gtsam.Pose2(2, 0, np.pi/2), odometry_model))
graph.add(Between(4, 5, gtsam.Pose2(2, 0, np.pi/2), odometry_model))

# Add the loop closure constraint
graph.add(Between(5, 2, gtsam.Pose2(2, 0, np.pi/2), odometry_model))
Before we can optimize, we need to create an initial estimate. In GTSAM, this is done via the Values type, as shown in Figure 3. We can use this initial estimate to show the factor graph in Figure 4. It does not look as pretty as the hand-crafted figure, but it has the advantage that it can be programmatically generated.
#| caption: Create the initial estimate.
#| label: fig:create-initial-estimate
initial_estimate = gtsam.Values()
initial_estimate.insert(1, gtsam.Pose2(0.5, 0.0, 0.2))
initial_estimate.insert(2, gtsam.Pose2(2.3, 0.1, -0.2))
initial_estimate.insert(3, gtsam.Pose2(4.1, 0.1, np.pi/2))
initial_estimate.insert(4, gtsam.Pose2(4.0, 2.0, np.pi))
initial_estimate.insert(5, gtsam.Pose2(2.1, 2.1, -np.pi/2))
print(initial_estimate)
Values with 5 values:
Value 1: (gtsam::Pose2)
(0.5, 0, 0.2)

Value 2: (gtsam::Pose2)
(2.3, 0.1, -0.2)

Value 3: (gtsam::Pose2)
(4.1, 0.1, 1.5708)

Value 4: (gtsam::Pose2)
(4, 2, 3.14159)

Value 5: (gtsam::Pose2)
(2.1, 2.1, -1.5708)
#| caption: Factor graph with odometry and loop closure constraints.
#| label: fig:factor_graph_with_loop_closure
show(graph, initial_estimate, binary_edges=True)

Optimization is done using nonlinear minimization, as explained above. In GTSAM, this is done via a NonlinearOptimizer class. The specific optimizer we use below is GaussNewtonOptimizer, which exactly implements the pseudocode given above, but exploiting sparsity in the factor graph to do this very efficiently. The optimizer only needs a graph and an initial estimate, both of which we already created. Hence the code, shown in Figure 5 is quite simple; the final optimized result is shown there as well, albeit as plain text.
#| caption: Optimize the initial values using a Gauss-Newton nonlinear optimizer.
#| label: fig:optimize-graph
optimizer = gtsam.GaussNewtonOptimizer(graph, initial_estimate)
result = optimizer.optimize()
print("Final Result:\n{}".format(result))
Final Result:
Values with 5 values:
Value 1: (gtsam::Pose2)
(-2.76843e-20, -8.152e-20, -3.57721e-20)

Value 2: (gtsam::Pose2)
(2, -1.89295e-19, -5.34287e-20)

Value 3: (gtsam::Pose2)
(4, -3.42174e-11, 1.5708)

Value 4: (gtsam::Pose2)
(4, 2, 3.14159)

Value 5: (gtsam::Pose2)
(2, 2, -1.5708)
We can also inspect the result graphically. Looking at the result as printed above only gets us so far, and more importantly, it only shows us the maximum a posteriori (MAP) solution, but not the uncertainty around it. Luckily, GTSAM can also compute the posterior marginals, which show the uncertainty on each recovered pose as a conditional Gaussian density \(P(T_i|Z)\), taking into account all the measurements \(Z\).
#| caption: The optimized trajectory with the estimated covariances.
#| label: fig:optimized_trajectory_with_covariances
marginals = gtsam.Marginals(graph, result)
for i in range(1, 6):
    gtsam_plot.plot_pose2(0, result.atPose2(i), 0.5,
                          marginals.marginalCovariance(i))
plt.axis('equal'); plt.show()
In code, we do this via the Marginals object, and we can plot marginals with a special function plot_pose2, as shown in Figure 6, which also shows the result graphically along with covariance ellipses. These covariance ellipses
in 2D indicate the marginal over position, over all possible
orientations, and show the area that contains 99% of the probability
mass (in 1D this would correspond to three standard deviations). The graph
shows in a clear manner that the uncertainty on pose \(T_{5}\) is now
much less than if there would be only odometry measurements. The pose
with the highest uncertainty, \(T_{4}\), is the one furthest away from
the unary constraint \(f_{0}(T_{1})\), which is the only factor tying
the graph to a global coordinate frame.
6.4.9. SLAM with Landmarks#
Take PoseSLAM, add landmarks.
So far we optimized over one type of variable, but often we build a landmark map simultaneously with the trajectory, i.e., this is true SLAM. In the next chapter, we will more thoroughly examine the full 3D case, whereas here we will model landmarks with 2D points in the plane. That does not mean that they cannot represent real 3D entities in the environment: they can be the location of trees, poles, building corners, the sides of windows, the location of a stop sign in traffic, even moving pedestrians in more advanced applications.
How do we measure such landmarks? The most typical type of measurements are either range measurements, bearing measurements, or bearing-range measurements. The details on how to obtain them are typically application-dependent, and below we will abstract away the sensor preprocessing details. For example, in the case of a LIDAR sensor, bearing-range measurements can be obtained by preprocessing every LIDAR scan, detecting prominent vertical structures for example. A real-life example that we will discuss below involves detecting and measuring the bearing-range to trees. Radar is another often-used sensor for autonomous driving, and it can often be modeled or idealized to give bearing-range measurements as well.
To illustrate SLAM with landmarks, we build a small toy example with 3 bearing-range measurements to two different landmarks:
slam_graph = gtsam.NonlinearFactorGraph()
slam_graph.add( gtsam.PriorFactorPose2(1, gtsam.Pose2(0.0, 0.0, 0.0), prior_model))
slam_graph.add(Between(1, 2, gtsam.Pose2(2.0, 0.0, 0.0), odometry_model))
slam_graph.add(Between(2, 3, gtsam.Pose2(2.0, 0.0, 0.0), odometry_model))
# Add Range-Bearing measurements to two different landmarks L1 and L2
measurement_model = gtsam.noiseModel.Diagonal.Sigmas(np.array([0.1, 0.2]))
BR = gtsam.BearingRangeFactor2D
l = {k:gtsam.symbol('l',k) for k in [1,2]} # name landmark variables
slam_graph.add(BR(1, l[1], gtsam.Rot2.fromDegrees(45),np.sqrt(4.0 + 4.0), measurement_model)) # pose 1 -*- landmark 1
slam_graph.add(BR(2, l[1], gtsam.Rot2.fromDegrees(90), 2.0,measurement_model)) # pose 2 -*- landmark 1
slam_graph.add(BR(3, l[2], gtsam.Rot2.fromDegrees(90), 2.0,measurement_model)) # pose 3 -*- landmark 2
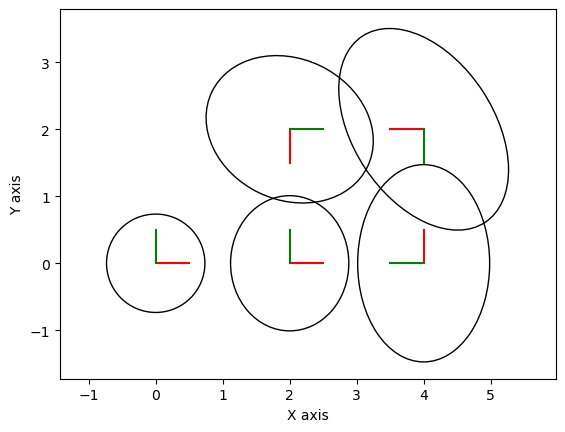
When we have an initial estimate, we can look at the structure of this factor graph. We create the initial estimate and show the resulting factor graph in Figure 7.
#| caption: Factor graph with odometry and range-bearing constraints.
#| label: fig:factor_graph_with_range_bearing
slam_initial = gtsam.Values()
slam_initial.insert(1, gtsam.Pose2(-0.25, 0.20, 0.15))
slam_initial.insert(2, gtsam.Pose2(2.30, 0.10, -0.20))
slam_initial.insert(3, gtsam.Pose2(4.10, 0.10, 0.10))
slam_initial.insert(l[1], gtsam.Point2(1.80, 2.10))
slam_initial.insert(l[2], gtsam.Point2(4.10, 1.80))
show(slam_graph, slam_initial, binary_edges=True)

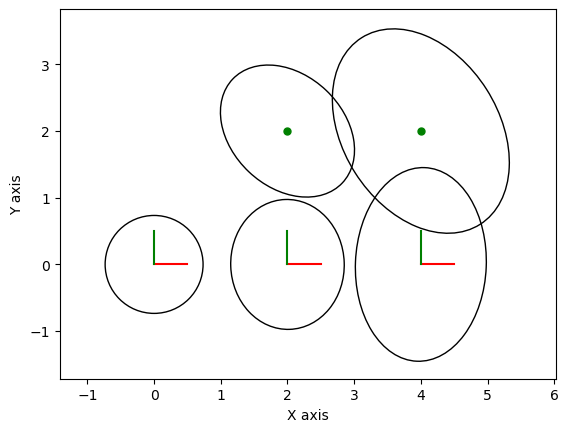
We optimize again using Levenberg Marquardt, and show the marginals on both robot position and landmarks, as before, in Figure 8.
#| caption: The optimized trajectory with the estimated covariances, with bearing-range measurements to landmarks.
#| label: fig:optimized_trajectory_with_covariances_and_landmarks_br
optimizer = gtsam.LevenbergMarquardtOptimizer(slam_graph, slam_initial)
slam_result = optimizer.optimize()
marginals = gtsam.Marginals(slam_graph, slam_result)
for k in [1,2,3]:
    gtsam_plot.plot_pose2(0, slam_result.atPose2(k), 0.5, marginals.marginalCovariance(k))
for j in [1,2]:
    gtsam_plot.plot_point2(0, slam_result.atPoint2(l[j]), 'g', P=marginals.marginalCovariance(l[j]))
plt.axis('equal'); plt.show()
6.4.10. A Larger SLAM Example#
Below we optimize a piece of the (old) Victoria park dataset, which involves a truck driving through a park in Sydney, extracting the position of trees in the park from LIDAR scans, just as we discussed above. The factor graph for this example is created from a file and shown in Figure 9.
#| caption: Factor graph for a more realistic example, derived from a real-world dataset.
#| label: fig:factor_graph_real_world
datafile = gtsam.findExampleDataFile('example.graph')
model = gtsam.noiseModel.Diagonal.Sigmas([0.05,0.05,2*math.pi/180])
[graph,initial] = gtsam.load2D(datafile, model)
show(graph,initial, binary_edges=True)

This is a much larger factor graph than any we have encountered before, and we can distinguish several features:
There is a prominent backbone of truck poses, connected via odometry measurements.
There are about 20 landmarks, some of which are seen briefly, while others are seen for longer periods of time.
The graph is very sparsely connected, and hence optimization will still be quite fast.
Optimizing with LevenbergMarquardtOptimizer, again:
initial_poses = gtsam.utilities.extractPose2(initial)
for i in range(initial_poses.shape[0]):
    initial.update(i, initial.atPose2(i).retract(np.random.normal(scale=0.5,size=(3,))))
optimizer = gtsam.LevenbergMarquardtOptimizer(graph, initial)
result = optimizer.optimize()
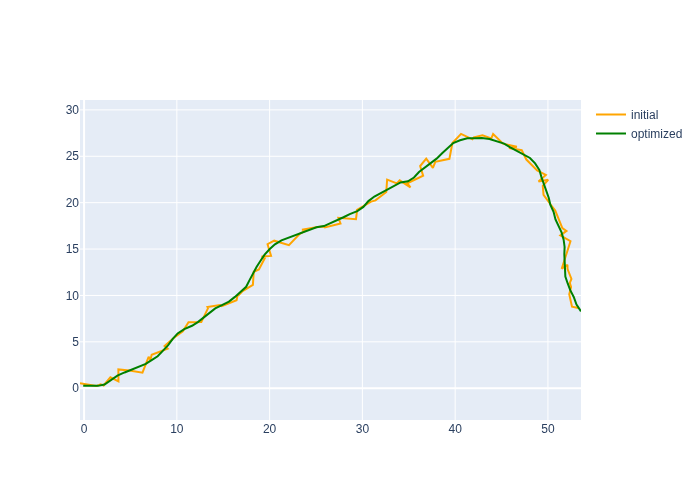
In Figure 10 we plot both the initial estimate, which was created by adding random noise on top of the ground truth, and the optimized trajectory.
#| caption: Initial and optimized trajectories for a more realistic example.
#| label: fig:initial_and_optimized_trajectories
initial_poses = gtsam.utilities.extractPose2(initial)
fig = go.Figure()
fig.add_scatter(x=initial_poses[:,0], y=initial_poses[:,1], name="initial", marker=dict(color='orange'))
final_poses = gtsam.utilities.extractPose2(result)
fig.add_scatter(x=final_poses[:,0], y=final_poses[:,1], name="optimized", marker=dict(color='green'))
fig.update_yaxes(scaleanchor = "x",scaleratio = 1);
fig.show()